Lyft: The power of friend recommendations
Up to now the work and projects I have completed deal with large amounts of data collected from sensors such as mobile phones or cameras. I have implemented various Machine Learning techniques however there is an entire field of Discrete Choice Modeling (DCM) that I have neglected. This project aims to rectify this by implementing an Integrated Choice Latent Variable Model (ICLVM) and investigate the effect of a friends recommendation on a persons decision to use the Lyft ride-share service.
A benefit of DCMs is there ability to accurately predict by directly asking about features you think effect a persons decision making process. However they are limited due to the amount of data. Training and modeling requires individuals to fill out a survey. While this type of data is rich it is not as readily available as sensors readings and is certainly not available in such an abundance.
Overview:
In the past year "ride sharing on-demand" companies such as Lyft and Uber have emerged which allow people to request and pay for a taxi-like service using a mobile application. An issue of safety arises as these drivers are not registered in the same manner as traditional taxi drivers. Additional uncertainty about the service arises from the payment method being implemented. Unlike paying the driver directly as with traditional taxis, passengers of the service make a donation guided by a suggested amount on their phone upon the completion of the journey.
There has been a strong negative response to the Lyft service from taxi drivers and some public transportation agencies. Taxi drivers claim that these "bandit taxis" are stealing potential customers and the Lyft office based in L.A. has been sent cease-and-desist letters from the L.A. transportation department. These cease and desist letters have resulted in drivers of the Lyft service being potentially fined, having their cars impounded or being arrested. People may see the reaction of these trusted bodies and decide never to try or experiment with Lyft. Seeing the strong negative reaction to the service they may feel that it is unsafe or unreliable.
The Lyft service is built around a social network with a strong sense of community. To gain access to the Lyft service you must register and link to your Facebook profile. It is customary to fist-bump your driver before a journey begins and cars using the service must be marked by a large pink mustache. People seeing these fun stickers on the street may feel safer about the service. Those who are not initial deterred by the bad press may find that it is rather enjoyable and social. If they report a positive experience to their friends or family members would that encourage or influence their decision to use the service? Given that the drivers are not officially registered and the payments are suggested donations do people feel comfortable\safe enough to use this new unfamiliar service? If they do feel uncomfortable would a friend recommendation help?
This work looks at investigating how a friends recommendation affects a persons likelihood of using the Lyft service over a traditional Taxi. The two main questions I am interested in answering are:
- How likely is a person to use the Lyft service if it was recommended to them by a friend?
- If people do not feel comfortable using this service does a friends recommendation change this?
Data acquisition:
For this work a stated preference survey was created. The main population I was looking to capture were people who were hesitant about using the service or new users/people who have not used Lyft before. The aim of the model was to determine how a friend recommendation affect a persons likelihood of using Lyft.
For data collection the Qualtrics service was utilized. In order to obtain a representative sample of new Lyft users I made contact with Lyft explaining the work and linked the survey on their twitter feed. I also utilized various mailing lists in Berkeley. Sixty-four people responded to the survey. For the stated preference there were ten hypothetical journeys drawn randomly from a pool of twenty-six resulting in a total of six hundred and forty data points for training.
For the survey I presented each participant with ten choice sets pertaining to a trip in a city. Each set presented two alternatives, traveling via Lyft or via Taxi. The dependent variable in this work was the travel mode chosen by the individual. I expected the explanatory variables that influence the persons choice to include attributes of the alternative (wait time, cost, friend recommendations, perceived safety of choice) and characteristics of the decision maker (sociodemographic features such as age, demographic and average education level). An example choice set presented to a respondent is given below.
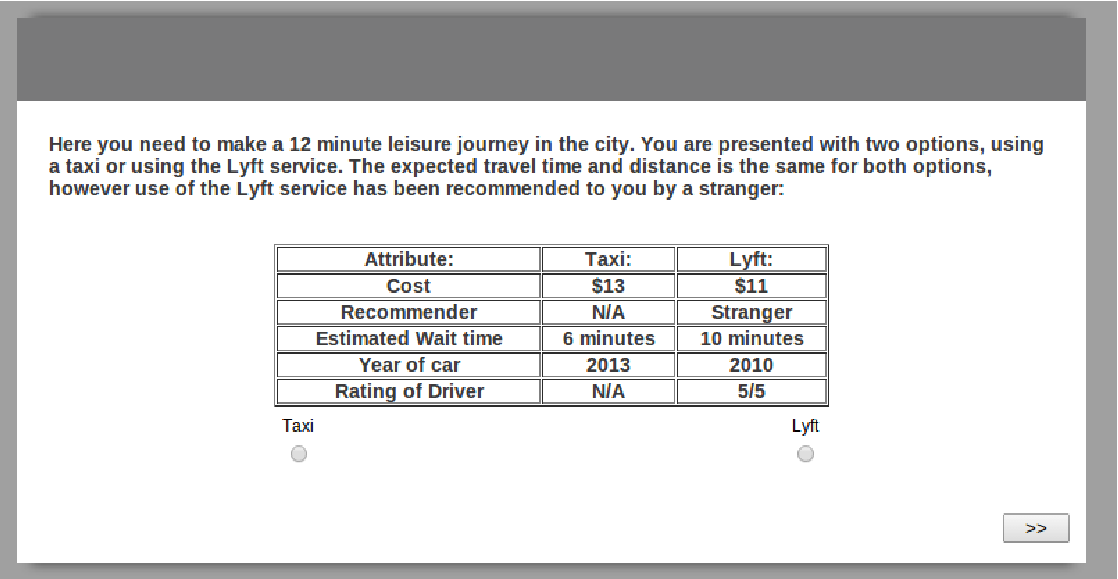
The main attributes I was looking to capture were the cost of the journey, the estimated wait time for the taxi or Lyft to arrive for pickup, the strength of the friendship of the person who recommended the Lyft service, the year of the car and the rating of the driver. The attributes were altered in each question to minimize their co-occurrence. I also asked for certain characteristics of the respondent. These characteristics included age, gender, ethnicity, zip code and profession. I then asked about current Lyft exposure. Lyft is a very community and social based service, the current level of exposure may bias the decision maker. Here I asked about whether the person has heard of Lyft before, if they have any family members or friends who use the service, how much the service appeals to them, whether they have tried the service and if they have how often they utilized it. Finally I asked for the average yearly amount in dollars spent on Lyft.
The next set of questions dealt with the uses current experience and proclivity towards the Taxi industry. This section of questions asked about the frequency of taxi use, how often the person travels alone in the taxi, how comfortable they find the taxi and the level of trust they have for the driver. Finally I asked for the average yearly amount in dollars spent on Taxis.
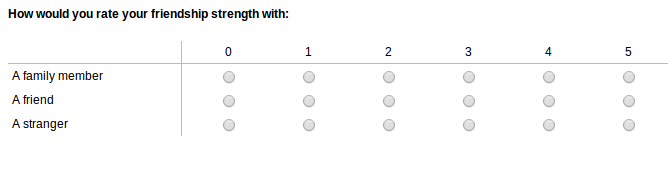
As people have different types of relationship with different people I asked the user to rate the strength of their friendship with their friends:
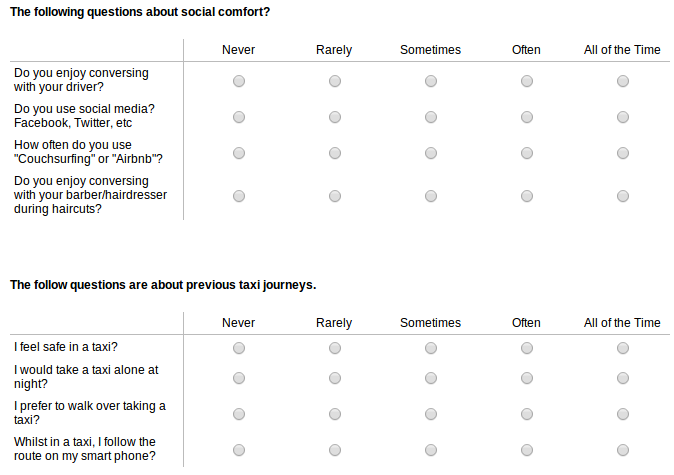
It was hypothesized a priori that there would be two latent factors affecting the decision to use Lyft. One which represented the socialness of the decisions makers and one that represented the safety of the decision maker. Indicators for these latent groups were captured by asking eight questions pertaining to social tendencies and perceived safety. The answers to these questions were on a five point Likert scale. The eight questions asked where divided into two groups each of which contained four questions relating to one of the two latent groups.
For this work I received a total of sixty-four respondents. The respondents were primarily from the Bay Area with a 53% to 47% split on male and female and a 53% to 47% split on student and employed. 59% of the respondents had heard about Lyft before, 85% of the respondents had not used Lyft before, 28% knew a family member or friend who used the service and the appeal of the Lyft service was mixed.
Model:
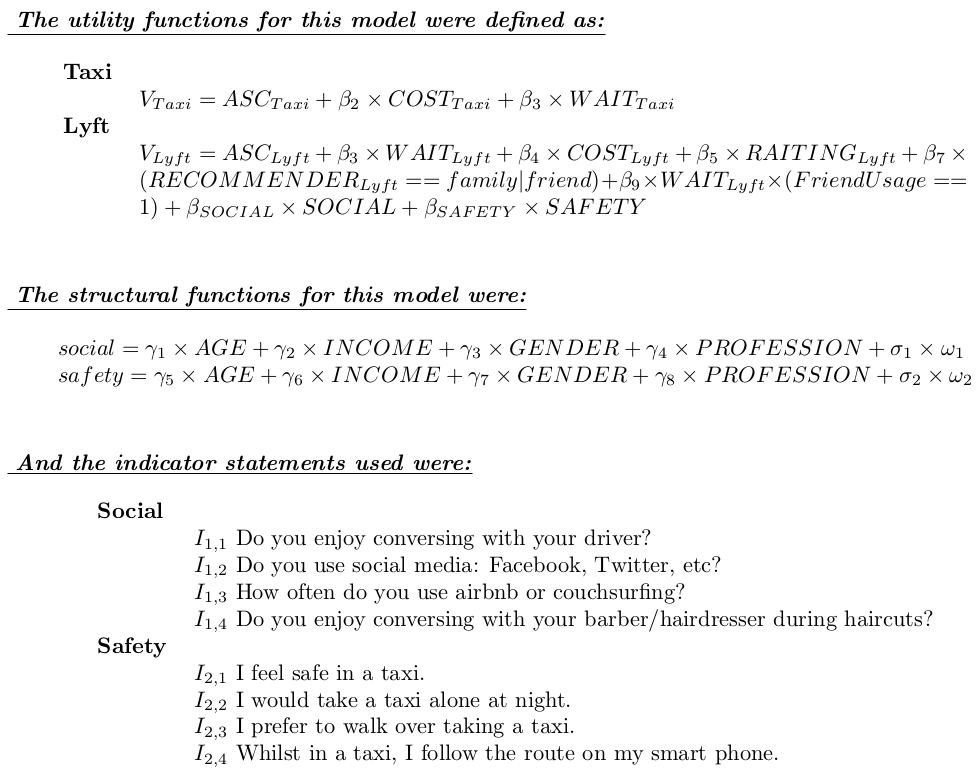
For this project I chose to implement an Integrated Choice Latent Variable Model (ICLV). In addition to the usually studied directly observable variables such as travel cost and wait time I hypothesized that for the choice between Taxi or Lyft a persons attitude towards socialness and perceived safety would impact their travel choice. The final estimated model parameters and model specification are shown in a table below and the estimates match my prior expectations.
From the table you can see that wait time and cost have a negative impact on the utility of that option. The more expensive the trip or the longer you had to wait the less desirable the option was. The driver rating is positive and a recommendation from a family or friend is positive relative to a stranger. This is shows that the higher the driver rating the more attractive the Lyft option is. Similarly a recommendation makes the option more desirable than a recommendation from a stranger. I also found that people who have a friend who uses the service are less sensitive to wait time then those who don't. Interestingly the year of the car proved to be insignificant and so it was removed from the model.
In addition to this I wanted to capture various heterogeneities such as sensitivity to wait time or cost given the person has used the service before, however due to the lack of data these were shown to be statistically insignificant. I did found that the effect of a recommendation from a family or friend on someone who had a negative opinion of Lyft was positive and of equal magnitude to the negative effect of the poor opinion of Lyft. This suggests that these cancel out and a family or friend recommendation would overcome your initial discomfort about using the service. However again due to the lack of data these values were shown to not be statistically significant.
From the estimated parameters I found that the value of waiting time for a Taxi was \$18.83 an hour and for Lyft was \$19.64 an hour. The estimated value of waiting time for someone choosing Lyft who knows someone who uses or used the Lyft service is \$8.13 an hour.
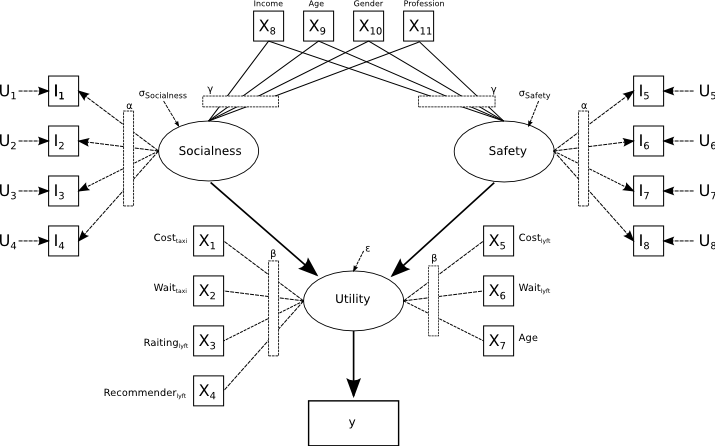
The two latent factors captured here have been interpreted as "Socialness" and "Safety". The "Socialness" factor contains statements 1,2,3 and 4 all of which deal with how people react in a social situations or how integrated they are with social media. This value was positive but was not significant, however at 0.15 it was included into the model. This shows that socialness has a positive impact on the utility of the Lyft. This was expected as the Lyft service is very socially orientated and brands itself as "your friend with a car". The second latent variable was named “Safety. From the statements 5,6,7 and 8 we see that most of the statements deal with how comfortable a person is in a taxi. These statements looked at persons tendency to take a taxi alone and how safe they feel in a taxi. This has a negative impact on the Lyft utility showing that it makes the Lyft choice less desirably. This is in agreement with my initial hypothesis. The indicator statements, systematic equation and utility equation are provided below.
| Parameter | Description | Estimate | Std. Error | t-stat | p-value |
|---|---|---|---|---|---|
$\beta_2$ | Taxi Cost($) | -0.411 | 0.0871 | -4.72 | 0.00 |
$\beta_4$ | Lyft Cost($) | -0.394 | 0.0910 | -4.33 | 0.00 |
$\beta_3$ | Wait Time(minutes) | -0.129 | 0.0448 | -2.89 | 0.00 |
$\beta_5$ | Lyft Driver Rating | 0.714 | 0.163 | 4.387 | 0.00 |
$\beta_7$ | Family\Friend Recommendation | 1.41 | 0.305 | 4.62 | 0.00 |
$\beta_8$ | Wait time given friend usage | 0.0756 | 0.0724 | 1.04 | 0.30 |
| ASC Taxi | 0 | ||||
| ASC Lyft | -2.33 | 1.57 | -1.48 | 0.14 | |
| Safety | -4.99 | 1.71 | -2.92 | 0.00 | |
Standard Deviation | 0.410 | 0.0802 | -5.11 | 0.00 | |
$\gamma_7$ | Female Gender | 0.0674 | 0.134 | 0.50 | 0.62 |
$\gamma_6$ | Income | 0.0895 | 0.0602 | 1.49 | 0.14 |
$\gamma_8$ | Profession | 0.0452 | 0.137 | 0.33 | 0.74 |
$\gamma_5$ | Age | 0.249 | 0.209 | 1.19 | 0.23 |
| Socialness | 0.365 | 0.252 | 1.45 | 0.15 | |
Standard Deviation | 1.11 | 0.0118 | 94.36 | 0.00 | |
$\gamma_3$ | Female Gender | -0.327 | 0.0304 | -10.77 | 0.00 |
$\gamma_2$ | Income | 0.289 | 0.0108 | 26.75 | 0.00 |
$\gamma_4$ | Profession | 0.661 | 0.0396 | 16.67 | 0.00 |
$\gamma_1$ | Age | 0.249 | 0.0348 | 7.15 | 0.00 |
| Statement1 - Mean | 1.78 | 0.0487 | 36.45 | 0.00 | |
Socialness | 1 | ||||
Standard Deviation | 0.0244 | 0.00928 | 2.63 | 0.01 | |
| Statement2 - Mean | 3.06 | 0.304 | 10.06 | 0.00 | |
Socialness | 0.230 | 0.176 | 1.31 | 0.19 | |
Standard Deviation | 1.22 | 0.117 | 10.43 | 0.00 | |
| Statement3 - Mean | 1.56 | 0.248 | 6.31 | 0.00 | |
Socialness | 0.201 | 0.191 | 1.05 | 0.29 | |
Standard Deviation | 1.20 | 0.114 | 10.56 | 0.00 | |
| Statement4 - Mean | 2.12 | 0.225 | 9.39 | 0.00 | |
Socialness | 0.617 | 0.162 | 3.80 | 0.00 | |
Standard Deviation | 0.917 | 0.111 | 8.24 | 0.00 | |
| Statement5 - Mean | 3.34 | 0.2937 | 11.41 | 0.00 | |
Safety | 1 | ||||
Standard Deviation | 0.704 | 0.0863 | 8.15 | 0.00 | |
| Statement6 - Mean | 2.72 | 0.607 | 4.48 | 0.00 | |
Safety | 1.74 | 0.369 | 4.70 | 0.00 | |
Standard Deviation | 0.971 | 0.121 | 8.03 | 0.00 | |
| Statement7 - Mean | 2.84 | 0.393 | 7.22 | 0.00 | |
Safety | -0.0657 | 0.655 | -0.10 | 0.92 | |
Standard Deviation | 1.23 | 0.0983 | 12.48 | 0.00 | |
| Statement8 - Mean | 2.31 | 0.408 | 5.67 | 0.00 | |
Safety | -0.488 | 0.523 | -0.93 | 0.35 | |
Standard Deviation | 1.28 | 0.101 | 12.68 | 0.00 |
| Summary Statistic | |
|---|---|
| Number of draws | 200 |
| Number of Observations | 523 |
| Log-likelihood for final model | -887.126 |
$\rho$ | 0.661 |
$\bar{\rho}$ | 0.646 |
Conclusion:
The results found support my initial hypothesis. I found that a friend or family recommendation does have a positive effect on choosing to use the Lyft service. Similarly I found that the socialness and the safety have effects on the decision to use Lyft. Socialness has a positive effect on the utility while safety has a negative effect. These are both in keeping with prior expectations.
This was my first real use of DCMs and unfortunately the work here is limited due to inexperience and lack of data. Future work would dedicate more time to data acquisition and recruitment. This would allow me to show with statistical significance the additional effect of a friend recommendation on people who are hesitant about using the service. It would also allow me to significantly show the effect of recommendations on age groups. Along with this I would look at asking a wider range of likhart questions to get more potential indicators for the Latent model. Although the current estimated attributes are mostly significant asking a wider range of questions and preforming PCA on the results could potentially improve the latent variables however the trade off would be that the interpretation of the latent groups would be more difficult.
Finally a potential extension of this project would include the use of twitter data to try generalize the results to the population. I could compare the sentiment of tweets towards the Lyft service for area codes with the sentiments reported in the survey and using census data try map the predicted response to the Lyft service. This could also provided some estimates of the current penetration of the service, the availability of the service and the populations awareness of the service.
Special thanks to Akshay Vij for his help and guidance and all the people who took the time to fill out the survey.