Lottery: Is it truly uniform?
Is the lottery truly random or is there some sort of pattern to it? Are all the balls truly equal in size shape and weight? Some balls have two numbers others have only one. Does this affect the weight or shape and bias the ball in any way? My prior belief is that the lottery is random and balls are drawn from a uniform distribution, however I would like to statistically verify this. For this project I look at the previous seven years of Irish lottery results to show that the balls are all drawn from a uniform distribution. There are two main assumptions made with this work. The first is that the balls have not changed for each result I have. The second is that the ball selection mechanism has not changed.
Data acquisition:
The first part of this project revolved around data acquisition. In order to check if the ball draw is uniform I first need previous results. The Irish lottery website keeps a database of these values and allows a user to browse previous draws by selecting the appropriate year. In order to get a local copy of these values I wrote a quick python script that queried the website and parsed the results. Utilizing the Python modules urlib and beautifulsoup the website was hit and the results were pickled and saved in a local dictionary. Pickle was used so as not to hit the website an excess amount of times.
import BeautifulSoup
import urllib2
import dateutil.parser
import pickle

results = {}
for year in xrange(2013,2004,-1):

  ####################################################
  ## Retrive the lottery results for that year
  ####################################################
  url = 'http://www.lottonumbers.net/irish-lotto-results-%i.asp'%(year)
  soup = BeautifulSoup.BeautifulSoup(content)
  info = soup.findAll('td')

  ####################################################
  ## Values are stored as date,balls,jackpot
  ####################################################
  for i in xrange(0,len(info),3):
    info[i].a.sup.replaceWith(info[i].a.sup.renderContents()+'#@$')
    date = dateutil.parser.parse(info[i].text.replace('#@$',' '))
    balls = info[i+1].findAll(attrs={'class':"result ball  pngfix"})
    ball_numbers = []
    for ball in balls:
      ball_numbers.append(int(ball.text))
    jackpot = int(str(info[i+2].text).replace('€','').replace('R','').replace(',',''))
    results[str(date.date())] = {'balls':ball_numbers,'jackpot':jackpot,'date':date.date()}
I wasn't particularly happy about hitting the website this way however I was unable to find any public api. I certainly did not want to have to continuously hit the website each time I wanted to experiment with the data. Once a local copy was obtained the values were saved to a file.
with open('lottery_results_2013_2005.pkl','w') as f:
  pickle.dump(results,f)
Data Exploration:
Next data exploration was preformed. Here the data was plotted in various ways. The goal was to check for patterns or anomalies that may exist in the data. What was the overall frequency of the ball draws? Were there any seasonal trends in the data? What about weekly trends? The exploration was preformed in python using mathplotlib and numpy, however much more aesthetically pleasing graphs can be generated here using JavaScript.
This looks like a uniform distribution, though the low frequency of the last three numbers is a bit unusual. The important thing to remember is that we have zoomed into the top of the distribution so what we see here is most likely just the variance in observations due to noise. Next we look at a histogram for the draws with each bin being a day of the week. We know the days of the week that the lottery is held on and we want to verify that our data reflects this. We see that most draws take place on Tuesday or Friday with four taking place outside these days. This is in keeping with the lottery system and also takes into account the rare "special" lotteries that run on bank holidays etc.
Now taking just Tuesday and Friday we plot the frequency of ball observations to see if there any trends on these two days. Are some balls more likely to be observed on Tuesdays or are the draws independent of the day of the week?
Here it looks like ball draw is independent of day of the week. Next we can look at how frequent the ball draws are when partitioning the data based on year. We have nine different plots so it is rather busy figure and difficult to decipher. We can see that 2013 has less data which makes sense as the data was acquired midway through 2013. Also we can see that 2006 seems to have some anomalies in the last 3 numbers.
Data visualization is never "done". There are always more plots and more angles you can look at. However for this work I think we have explored the data to a reasonable degree.
Data analysis:
The main question I am looking to answer is whether or not this data was drawn from a uniform distribution. In order to check this we will preform the Pearson's chi square goodness of fit test.
Here we are setting the null hypothesis to be that the number of times each ball was drawn is equal. That is $H_0: d_1=d_2=d_3=\dots =d_{45}$ and the alternative hypothesis $H_A$ is that they are not all equal. If the probability of even one of the balls being drawn is not statistically equal to the rest then we will reject the null hypothesis. This would be an indication that balls were not drawn from a uniform distribution. There are forty-five balls in the Irish lottery so for this test we have 44 degrees of freedom.
In order to calculate the Chi square value the formula $X^2=\sum_{i=1}^{45}\frac{(d_i-n)^2}{n}$ was used. Here $d_i$ represents the frequency of the ball i (the number of times it was observed) and n is the average each ball should have been drawn (the expected value). In this case the data contains 844 lottery draws which is a total of 5064 ball draws. There are 45 balls so it is expect that each ball should have been drawn 112.533 times.
Calculating the $X^2$ value using the equation above we find that $X^2 = 75.2239$. The chi-square value with 44 degrees of freedom is given by $X^2_{44}= 56.369$. Here we can see that 75.2239 > 56.369 so we can reject the null hypothesis at the 95% confidence level. This suggests that all balls may not be equally likely to be drawn, the balls may not have been drawn from a uniform distribution.
This is a surprising result and merits further exploration. There are several explanations that may account for this result. My stated working assumptions my be false or incorrect. What if I change these and assume that balls are constant for only a year?
Doing the same test but for each year we get the following results:
| Year | $X^2$ |
| 2005 | 69.308 |
| 2006 | 67.731 |
| 2007 | 32.394 |
| 2008 | 43.571 |
| 2009 | 33.115 |
| 2010 | 42.058 |
| 2011 | 42.714 |
| 2012 | 42.058 |
| 2013 | 26.5 |
From the table above we can see that when dividing the data into yearly segments we fail to reject the null hypothesis at the 95% confidence level for all years but 2005 and 2006. In 2005 and 2006 we reject the null hypothesis. Lets go back to the visualization and look at the data for 2005 and 2006 in more detail.
We can now see that some anomalies appear to be happening. The number of draws for 43, 44 and 45 and extremely low in 2006 and nonexistent in 2005. This information was obscured in the plot of all 9 years. In order to try and explain this I did some further research and found an interesting piece of information.
The Irish lottery was won through brute force in May of 1992 when it was a 36 choose 6 system. In order to thwart this the system was changed in August 1992 to be a 39 choose 6 system. The lottery changed again in September of 1994 to be a 42 choose 6 system. The main point of interest is that the lottery stayed a 42 choose 6 system until November of 2006 when it became a 45 choose 6 system. This violates the assumption I was working under. I assumed that the lottery was always a 45 choose 6 system for my data. This means that for the tests I was preforming I was using an incorrect value for the degree of freedom and expected value.
To account of this I decided to drop 2006 and calculate the Chi square value for 2005 and 2007 to 2013. 2006 was a mixture of both 42 balls and 45 balls. Instead of trying to correctly partition this I just dropped the data.
Firstly looking at 2005 we now know that there are 42 balls so $ X^2 = 33.487 $. There are also 41 degrees of freedom so $ X^2_{41}= 54.090 $. Here $33.487 < 54.090$ we now fail to reject the null hypothesis at the 95% confidence level. Next looking at the observations from 2007 to 2013 we have $X^2 = 50.560$ and $X^2_{44}= 56.369$. Again we fail to reject the null hypothesis as $50.560 < 56.369$. This suggests that the lottery is in fact draw from a uniform distribution.
Despite probability telling me the chances of winning are $1 / C^{45}_6$, a probability of $\frac{1}{8145060}$ I really wanted to win the lottery. In order to attempt this I took the six most likely balls based on the initial frequency graph presented. These numbers were: 2,3,12,13,38 and 39. I purchased a ticket and also chose a "quick pick" which is 6 randomly generated numbers. Despite having done the math and knowing the odds I was still rather excited as I imagined possibilities that all started with "But what if..."
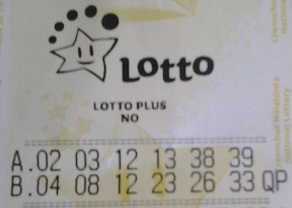
Unfortunately despite the data collected I failed to win the jackpot. I did happen to get one of the number though:

The quick pick fail to get any numbers. So what does this tell us... nothing really. All the balls were equally likely. It's just probability.